Chart Of The Week: Cathie Wood vs Warren Buffett – Head To Head – Last 10 Years – @ycharts
Sunday, May 8, 2022 · Johnny Hopkins
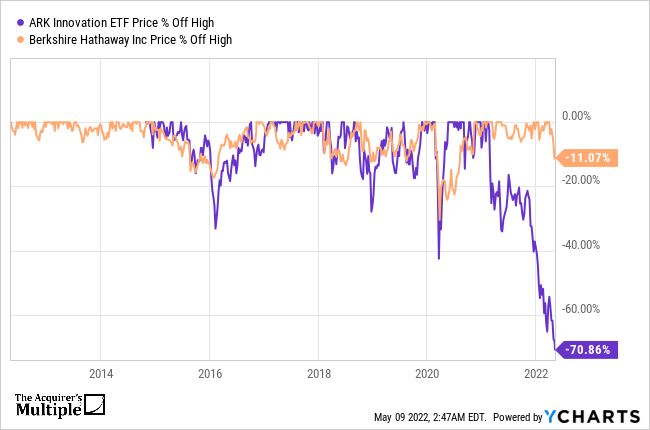
As part of a new weekly feature here at the Acquirer’s Multiple we’ll be providing some of our favorite charts of the week from @ycharts. This week we’ll take a look at a ‘head to head’ between Cathie Wood vs Warren Buffett over the last 10 years.
Current Share Price ($)
Berkshire Hathaway Inc (BRK.A) – $479,500
ARK Innovation ETF (ARKK) – $45.63

Change In Share Price (%)
Price % Change.
Berkshire Hathaway Inc (BRK.A) – 129.20%
ARK Innovation ETF (ARKK) – 123.90%

10K Invested Would Have Returned ($)
The present market value of a $10,000 investment.
Berkshire Hathaway Inc (BRK.A) – $22.92K
ARK Innovation ETF (ARKK) – $22.39K

Percentage Off High (%)
Percent Off All-time High tracks the percentage difference between the previous day’s closing price (P) and the All-Time high price (AP) of the security’s entire price history.
This metric tells you how far the price has deviated from /converged on the all-time high price.
Berkshire Hathaway Inc (BRK.A) -11.07%
ARK Innovation ETF (ARKK) -70.86%

 Where Is the Deep Value in Small and Micro Caps This Week?
 AI Stock Market Bubble: Can the Technology Succeed While Stocks Crash?