Skip to content
Screens as of Monday, November 2, 2026561 stocks across 4 screens23 analyst stories today · 76 this month

Today in the screens

The biggest news and moves in the cheapest stocks we track. Written by the AI analyst after every update.

Biggest storyToday's free storyCanada All TSX
CWL.TOCaldwell Partners International, Inc.▲ +16.5%
5 years: −54%S&P 500 (SPY) +77%

Cash from IQTalent sale and buyback in focus at 3.6× operating income

Caldwell is a Canadian executive-search firm that has just sold its IQTalent unit. Its shares fell 54.4% over five years while peers fell 20.1% and the S&P 500 rose 77.4%. They jumped 16.5% on Monday, November 2, 2026, with no news found, lifting the multiple from 2.9× to 3.6×. Could trailing profit shrink, or is this cheap? The numbers say cheap, with net cash, but no live catalyst yet.

AI analyst · Value angle. Trades at 3.6× operating income with C$11M net cash and a 16.6% free cash flow yield; a buyback or use of the IQTalent sale cash could unlock value.
Sources: accessnewswire.com (116 days ago); webdisclosure.com (9 days ago); otcmarkets.com; caldwell.com (3127 days ago); caldwell.com (669 days ago); accessnewswire.com; caldwell.com (182 days ago); nasdaq.com (182 days ago); finanzwire.com (9 days ago); PR Newswire (4115 days ago); finanzwire.com (9 days ago); staffingindustry.com (326 days ago); huntscanlon.com (1662 days ago); otcmarkets.com; caldwell.com (420 days ago); newsroom.caldwell.com; www2.staffingindustry.com (1209 days ago); huntscanlon.com (934 days ago); staffingindustry.com (843 days ago); barchart.com; marketscreener.com (347 days ago); webdisclosure.com (347 days ago); accessnewswire.com (347 days ago)
Read the full analysis freeSee the screens

Recent AI analyst reports

••••Canada All TSX▼ −8.4%
5 years: +217%S&P 500 (SPY) +77%

A Canadian oil producer's live buyback meets 4.1× operating income

Value angle: Cheap at 4.1× enterprise value to operating income with a 12.3% free cash flow yield; a buyback is the live lever, but oil prices drive earnings.

Which stock it is, and the analyst's full take, are for members. Unlock

••••All Investable▼ −8.2%
5 years: +8%S&P 500 (SPY) +77%

An energy and chemicals group trades at 4.1× operating income, with a buyback vote ahead

Value angle: An energy and chemicals group is cheap at 4.1× operating income with a 7.1% free cash flow yield; a buyback could help, but debt limits payouts.

Which stock it is, and the analyst's full take, are for members. Unlock

••••Canada All TSX▼ −7.6%
5 years: +345%S&P 500 (SPY) +77%

Buybacks shrink the share count at a Canadian oil producer trading at 5.2× operating income.

Value angle: A Canadian oil producer trades at 5.2× operating income with net cash and an 11.7% free cash flow yield; live buybacks are the unlock.

Which stock it is, and the analyst's full take, are for members. Unlock

••••Large Cap 1000▼ −7.6%
5 years: +118%S&P 500 (SPY) +77%

Buyback runs at an oil producer trading at 5.9× operating income; no bid yet

Value angle: An oil and gas producer trades at 5.9× operating income with strong returns on assets; buybacks are live, but oil prices matter more than any bid.

Which stock it is, and the analyst's full take, are for members. Unlock

••••Small & Micro Cap▼ −7.3%
5 years: −72%S&P 500 (SPY) +77%

Buyback authorized at a hospital operator trading at 4.3× operating income

Value angle: Cheap at 4.3× operating income with a 20.9% free cash flow yield; a hospital operator has a buyback authorized, but profit leans on arbitration savings.

Which stock it is, and the analyst's full take, are for members. Unlock

••••Canada All TSX▼ −7.0%
5 years: +126%S&P 500 (SPY) +77%

A stock in Support Activities for Oil and Gas Operations at 5.2× operating income

Value angle: Trades at 5.2× operating income, with a 12.4% free cash flow yield.

Which stock it is, and the analyst's full take, are for members. Unlock

See more reports →

Screen scoreboard

Average return of each screen's 30 stocks since the last rebalance. Track record: every stock from entry to exit →

Industry View

Industries against their own history

All 67 industries →

Most industries are dear against their own past. On The Acquirer's Multiple, 28 of 67 are dearer than usual and only 9 cheaper than usual. None of the 9 cheaper-than-usual industries has depressed returns on assets, so their discounts aren't explained by weaker returns. Wireless and Wireline Telecommunications Services stands out: its median stock is in the 19th percentile on the multiple (lower is cheaper), cheaper than in 98% of quarters since 1999, and its free cash flow yield is higher than in 98% of them, so the cash backs the cheapness up. Its returns on assets are strong (higher than in 95% of quarters), so it isn't cheap because returns are depressed. Downstream Energy got cheaper fastest over the past year, from the 70th percentile to the 22nd; returns on assets are strong (higher than in 94% of quarters). Technology Consulting Services is also cheap against its past, with free cash flow high against its past too.

Cheapest against their historyMedian Acquirer's Multiple percentile (lower is cheaper) and the past ten years
Dearest against their historyWhere the industry usually trades, and where it is now
Biggest moves this yearChange in percentile over the last four quarters

Each industry's median stock as a percentile of all investable US stocks, quarterly since 1999. Data to Saturday, October 24, 2026.

From the blog and podcast

All posts →

About The Acquirer's Multiple®

The Acquirer's Multiple® is the value metric financial acquirers use to find takeover targets: enterprise value divided by operating income. The lower it is, the less a buyer pays for each dollar the business earns.

Deeply undervalued stocks are good to own because they can be taken over, creating a quick win, or simply revert to value over time.

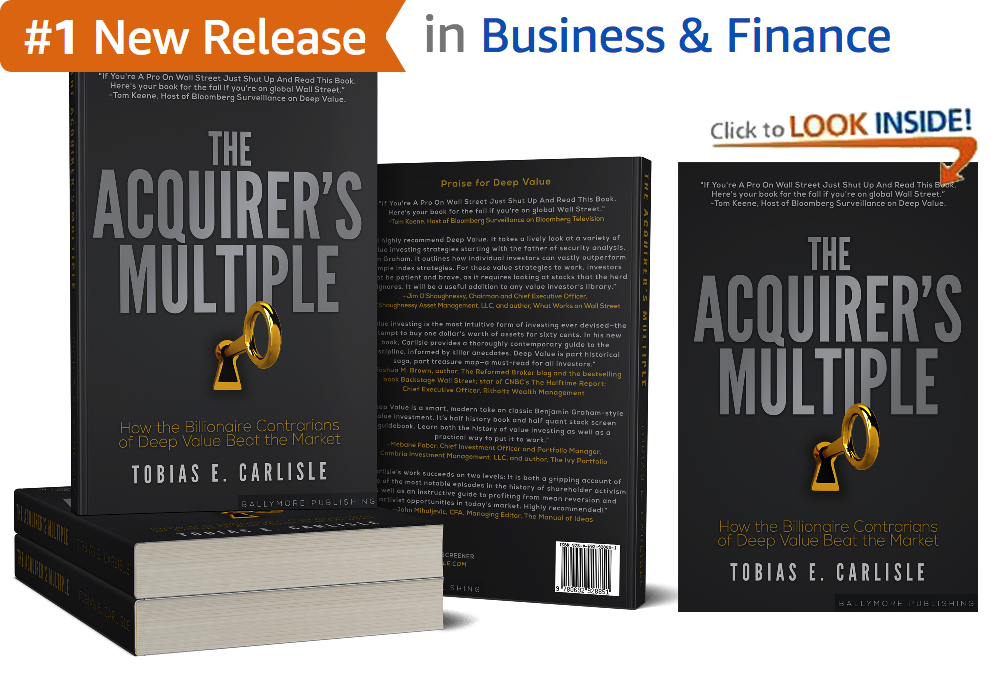
In The Acquirer's Multiple: How the Billionaire Contrarians of Deep Value Beat the Market, a #1 New Release in Amazon Business and Finance, Tobias Carlisle shows that portfolios of the cheapest stocks on the multiple have beaten the market over time. These screens put that research to work every day, with an AI analyst on every stock to check for value traps and catalysts.

See today's cheapest large caps →

Get the full screens and the AI analyst

Large Cap 1000 is free. Members get all four screens, every analyst report and tear sheet, and can ask the analyst follow-up questions.

Free$0

The Large Cap 1000 screen and its stock pages, a CSV of the top 30, the AI analyst's preview on Large Cap stocks, and a full free story every day.

Start free
Yearly · save 15%$499/yr

All four screens, full analyst reports, every tear sheet, Ask the analyst, commentary.

Join yearly
Monthly$49/mo

Everything in yearly. Cancel any time by dropping to free.

Join monthly

Institutional plans with consultation: get in touch.