
Small and Micro Cap Stock Screen Backtest
Monday, January 26, 2015 · Tobias Carlisle
Updated November 29, 2017
Since the last update in July 26, 2016, the screen had a strong finish to end the 2016 year up 35.5 percent, handily beating out the Russell 3000’s 12.2 percent by 20.4 percent.
2017 to date has been weaker. For the year, the Small and Micro Screen gained 12.0 percent, underperforming the Russell 3000’s strong 16.9 percent by a -4.9 percent.
Chart 1. Returns from January 2, 1999 to Date (Log.)
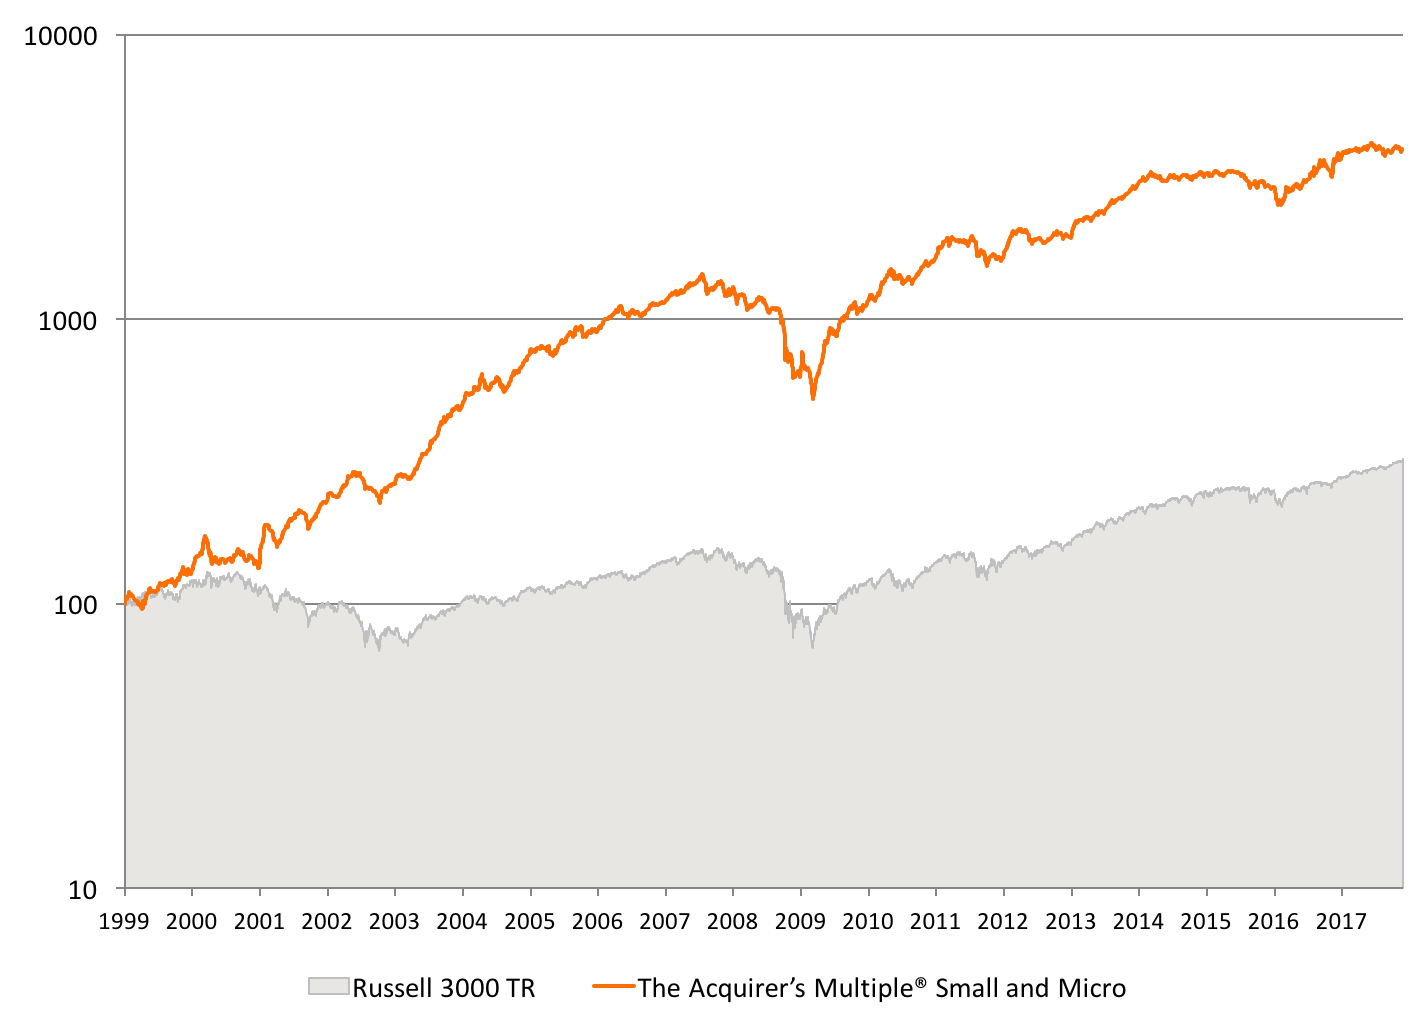
We backtested the returns to a theoretical portfolio of stocks selected by The Acquirer’s Multiple® from the Small and Micro Cap screen. The backtest assumed the portfolio bought and held for a year 30 stocks selected from the small and micro cap universe (the smallest half of stocks by market capitalization). The model portfolios were rebalanced on the first day of the year using the most recent fundamental data. The screen excluded stocks traded over-the-counter (OTC). The backtest ran from January 2, 1999 to date.
Over the full period, the screens generated a total return of 3,948 percent, or a compound growth rate (CAGR) of 21.5 percent per year. This compared favorably with the Russell 3000 TR, which returned a cumulative total of 321 percent, or 6.4 percent compound.
Chart 2. Yearly Returns from January 2, 1999 to Date
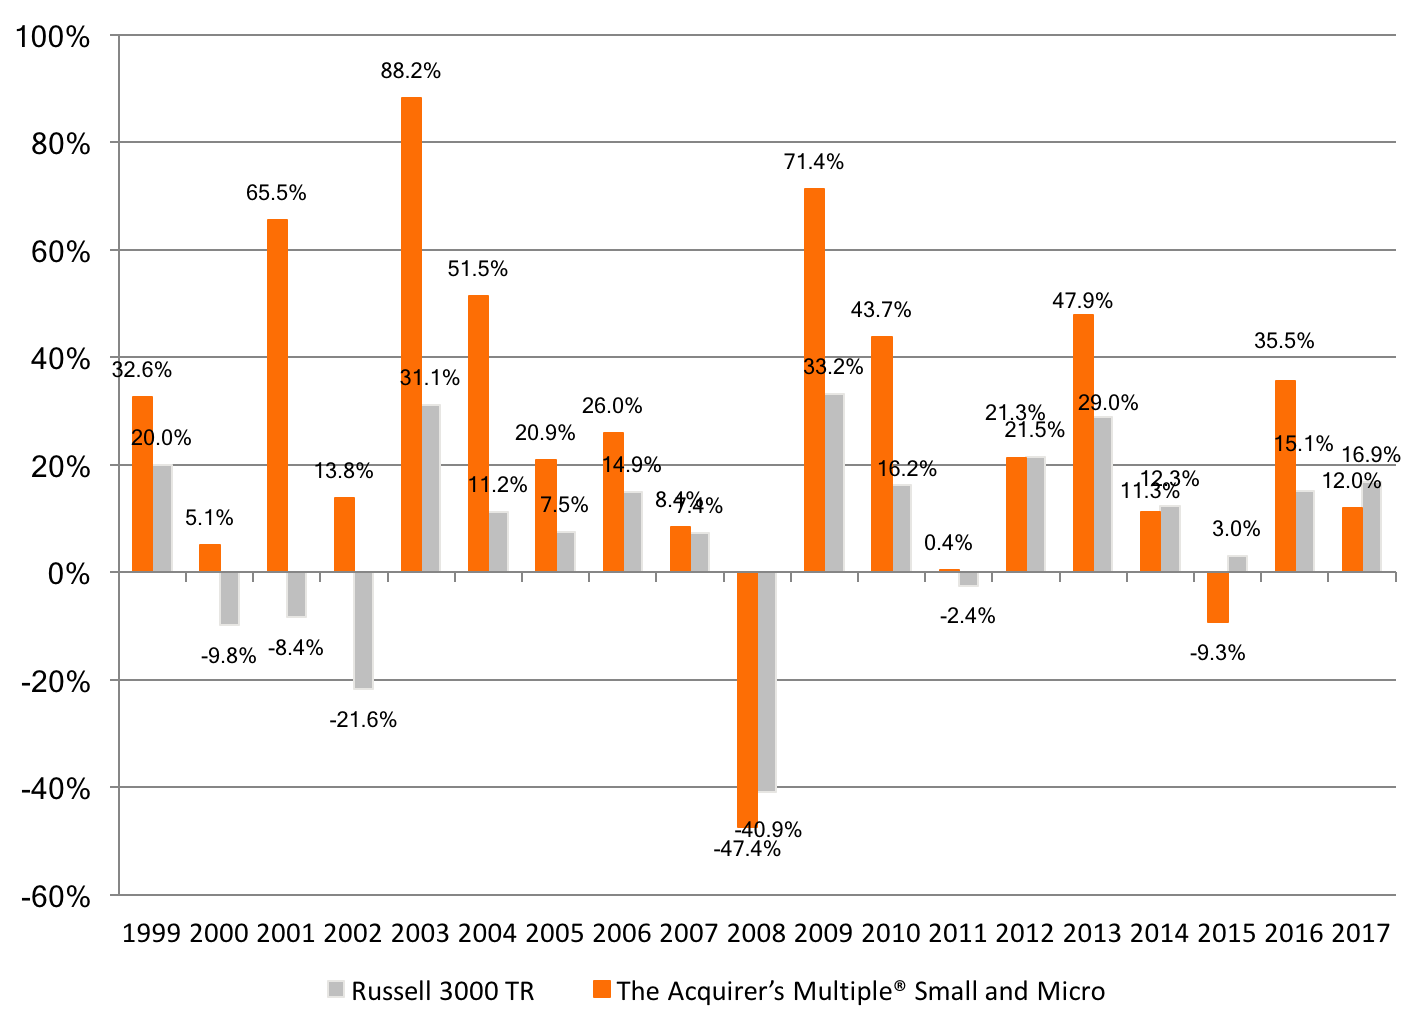
On an yearly basis, the model portfolios selected by The Acquirer’s Multiple® generally outperformed, although underperformed in 2008 (-6.5 percent), 2012 (-0.3 percent), 2014 (-1.0 percent), 2015 (-12.3 percent) and 2017 to date (-4.9 percent).
Chart 3. Rolling Yearly Returns from January 2, 1999 to Date
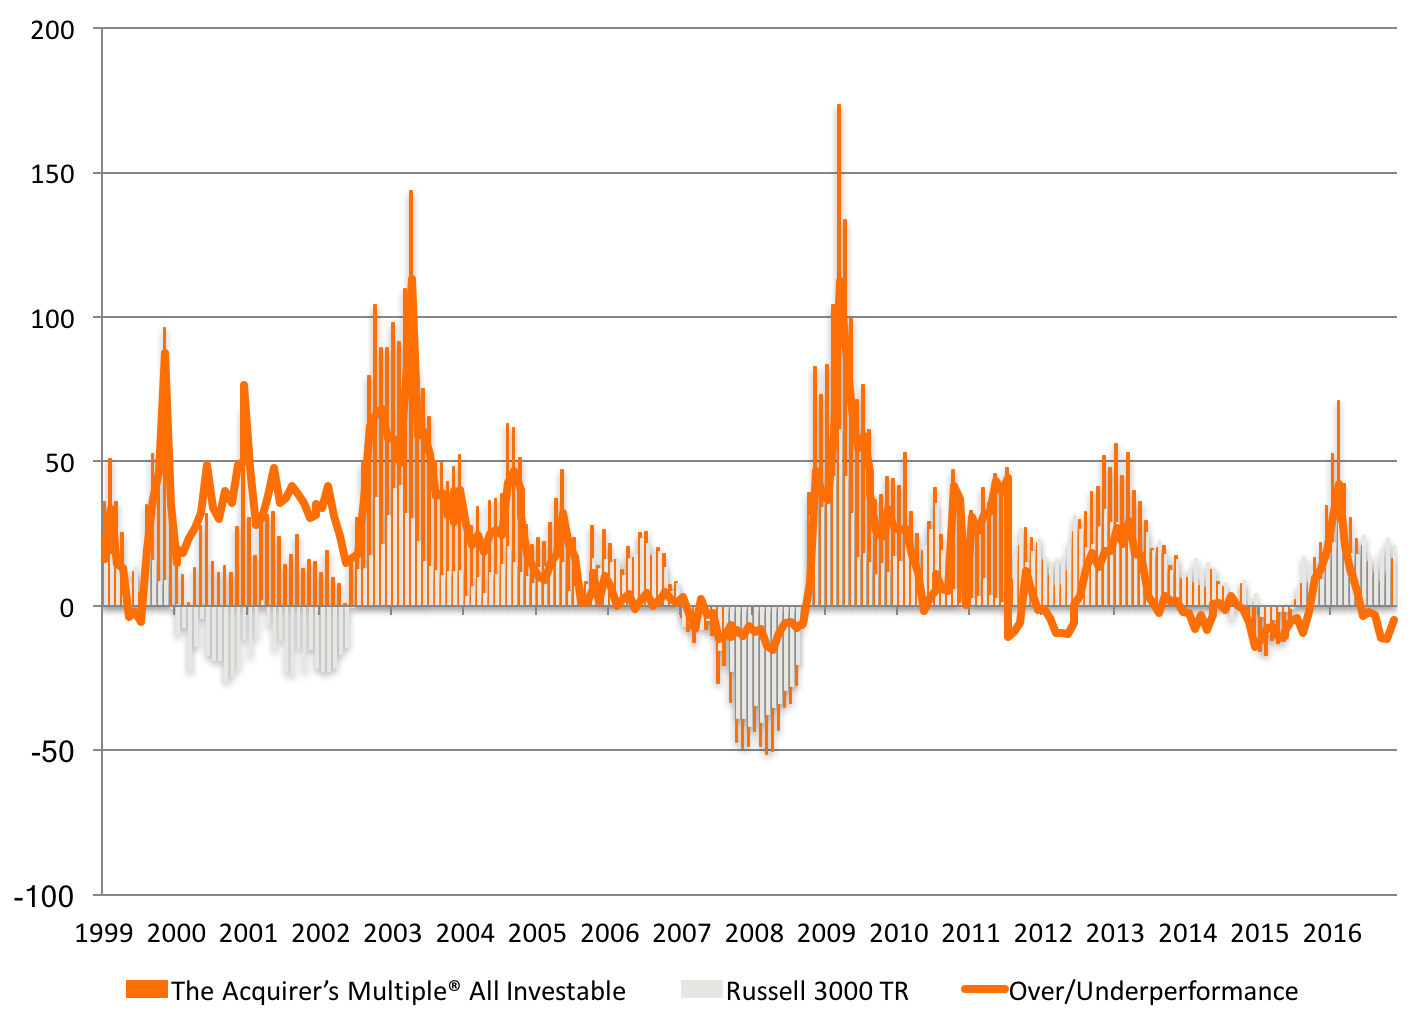
The average twelve-month return for any stock selected by The Acquirer’s Multiple® Small and Micro Cap screen was 25.8 percent, beating out the Russell 3000’s average stock at 7.6 percent by 19.2 percent.
Chart 4. Drawdowns from January 2, 1999 to Date
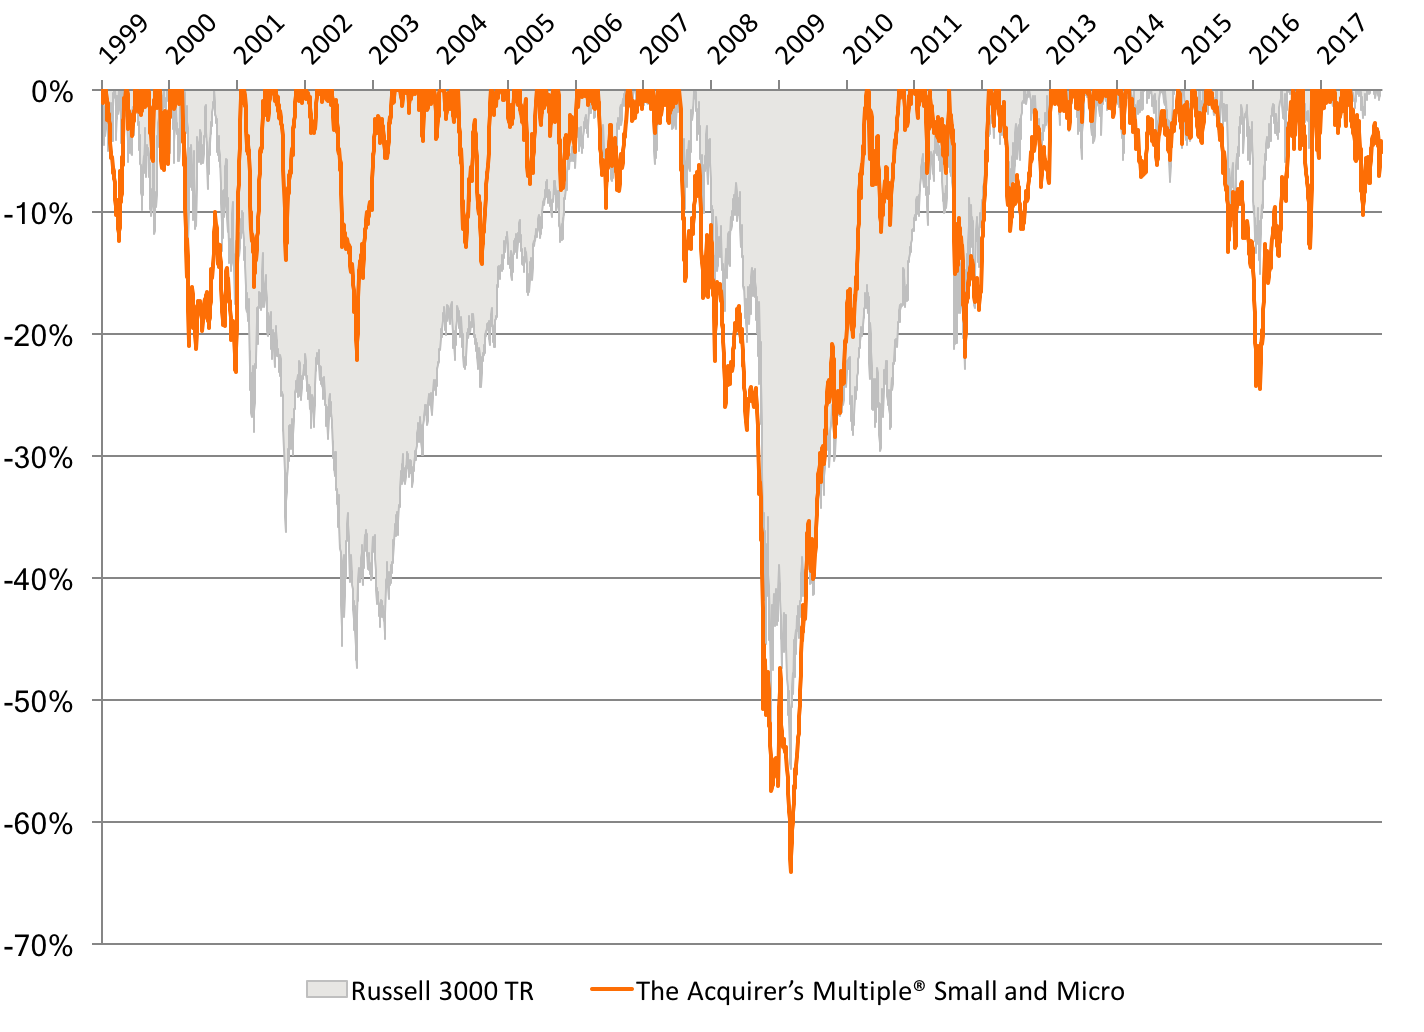
The worst drawdown for The Acquirer’s Multiple® screens was -64 percent, which occurred between July 2007 and March 2009. Over the same period, the Russell 3000 TR drew down -56 percent.
The 30-stock model portfolios selected by The Acquirer’s Multiple® from the Small and Micro Cap universe consistently outperformed the broader, and larger capitalization Russell 3000 TR. The trade off is periodic underperformance–approximately one in five years–and deeper drawdowns.
Disclaimer: Backtested performance does not represent actual performance and should not be interpreted as an indication of such performance. Actual performance may be materially lower than that of the backtested portfolios. Backtested performance results have certain inherent limitations. Such results do not represent the impact that material economic and market factors might have on an investor’s decision-making process if the investor was actually managing money. Backtested performance also differs from actual performance because it is achieved through the retroactive application of model portfolios (in this case, The Acquirer’s Multiple®) designed with the benefit of hindsight. As a result, the models theoretically may be changed from time to time and the effect on performance results could be either favorable or unfavorable.